
Data Processing
2

You have learnt in previous chapter that organising and presenting data makes them comprehensible. It facilitates data processing. A number of statistical techniques are used to analyse the data e.g.
While measures of central tendency provide the value that is an ideal representative of a set of observations, the measures of dispersion take into account the internal variations of the data, often around a measure of central tendency. The measures of relationship, on the other hand, provide the degree of association between any two or more related phenomena, like rainfall and incidence of flood or fertiliser consumption and yield of crops. In this chapter, you will learn the measures of central tendency.
Measures of Central Tendency
The measurable characteristics such as rainfall, elevation, density of population, levels of educational attainment or age groups vary. If we want to understand them, how would we do? We may, perhaps, require a single value or number that best represents all the observations. This single value usually lies near the centre of a distribution rather than at either extreme. The statistical techniques used to find out the centre of distributions are referred as measures of central tendency. The number denoting the central tendency is the representative figure for the entire data set because it is the point about which items have a tendency to cluster.
Measures of central tendency are also known as statistical averages. There are a number of the measures of central tendency, such as the mean, median and the mode.
Mean
The mean is the value which is derived by summing all the values and dividing it by the number of observations.
Median
The median is the value of the rank, which divides the arranged series into two equal numbers. It is independent of the actual value. Arranging the data in ascending or descending order and then finding the value of the middle ranking number is the most significant in calculating the median. In case of the even numbers the average of the two middle ranking values will be the median.
Mode
Mode is the maximum occurrence or frequency at a particular point or value. You may notice that each one of these measures is a different method of determining a single representative number suited to different types of the data sets.
Mean
Mean is the simple arithmetic average of the different values of a variable. For ungrouped and grouped data, the methods for calculating mean are necessarily different. Mean can be calculated by direct or indirect methods, for both grouped and ungrouped data.
Computing Mean from Ungrouped Data
Direct Method
While calculating mean from ungrouped data using the direct method, the values for each observation are added and the total number of occurrences are divided by the sum of all observations. The mean is calculated using the following formula:
Where,
Example 2.1 : Calculate the mean rainfall for Malwa Plateau in Madhya Pradesh from the rainfall of the districts of the region given in Table 2.1:
| Districts in Malwa Plateau | Normal Rainfall in mms | Indirect Method |
| x Direct Method | ||
| Indore | 979 | 179 |
| Dewas | 1083 | 283 |
| Dhar | 833 | 33 |
| Ratlam | 896 | 96 |
| Ujjain | 891 | 91 |
| Mandsaur | 825 | 25 |
| Shajapur | 977 | 177 |
| 6484 | 884 | |
| 926.29 | 126.29 |
The mean for the data given in Table 2.1 is computed as under:
It could be noted from the computation of the mean that the raw rainfall data have been added directly and the sum is divided by the number of observations i. e., districts. Therefore, it is known as direct method.
Indirect Method
For a large number of observations, the indirect method is normally used to compute the mean. It helps in reducing the values of the observations to smaller numbers by subtracting a constant value from them. For example, as shown in Table 2.1, the rainfall values lie between 800 and 1100 mm. We can reduce these values by selecting ‘assumed mean’ and subtracting the chosen number from each value. In the present case, we have taken 800 as assumed mean. Such an operation is known as coding. The mean is then worked out from these reduced numbers (Column 3 of Table 2.1).
The following formula is used in computing the mean using indirect method:
Where,
Mean for the data as shown in Table 2.1 can be computed using the indirect method in the following manner :
Note that the mean value comes the same when computed either of the two methods.
Computing Mean from Grouped Data
The mean is also computed for the grouped data using either direct or indirect method.
Direct Method
When scores are grouped into a frequency distribution, the individual values lose their identity. These values are represented by the midpoints of the class intervals in which they are located. While computing the mean from grouped data using direct method, the midpoint of each class interval is multiplied with its corresponding frequency ; all values of fx (the X are the midpoints) are added to obtain that is finally divided by the number of observations i. e., N. Hence, mean is calculated using the following formula :
Where :
Example 2.2 : Compute the average wage rate of factory workers using data given in Table 2.2:
| Wage Rate (Rs./day) | Number of workers (f) |
| Classes | f |
| 50 - 70 | 10 |
| 70 - 90 | 20 |
| 90 - 110 | 25 |
| 110 - 130 | 35 |
| 130 - 150 | 9 |
| Classes | Frequency (f) | Mid-points (x) | fx | d=x-100 | fd | U = (x-100)/20 | fu |
| 50-70 | 10 | 60 | 600 | -40 | -400 | -2 | -20 |
| 70-90 | 20 | 80 | 1,600 | -20 | -400 | -1 | -20 |
| 90-110 | 25 | 100 | 2,500 | 0 | 0 | 0 | 0 |
| 110-130 | 35 | 120 | 4,200 | 20 | 700 | 1 | 35 |
| 130-150 | 9 | 140 | 1,260 | 40 | 360 | 2 | 18 |
| and |
Where
Table 2.3 provides the procedure for calculating the mean for grouped data. In the given frequency distribution, ninety-nine workers have been grouped into five classes of wage rates. The midpoints of these groups are listed in the third column. To find the mean, each midpoint (X) has been multiplied by the frequency (f) and their sum ( ) divided by N.
The mean may be computed as under using the given formula :
Indirect Method
The following formula can be used for the indirect method for grouped data. The principles of this formula are similar to that of the indirect method given for ungrouped data. It is expressed as under
Where,
Midpoint of the assumed mean group
(The assumed mean group in Table 2.3 is 90 - 110 with 100 as midpoint.)
Frequency
Deviation from the assumed mean group (A)
Sum of cases or
Interval width (in this case, it is 20)
From Table 2.3 the following steps involved in computing mean using the direct method can be deduced :
The mean using indirect method is computed as under :
Note : The Indirect mean method will work for both equal and unequal class intervals.
Median
Median is a positional average. It may be defined “as the point in a distribution with an equal number of cases on each side of it”. The Median is expressed using symbol M.
Computing Median for Ungrouped Data
When the scores are ungrouped, these are arranged in ascending or descending order. Median can be found by locating the central observation or value in the arranged series. The central value may be located from either end of the series arranged in ascending or descending order. The following equation is used to compute the median :
Example 2.3: Calculate median height of mountain peaks in parts of the Himalayas using the following:
8,126 m, 8,611m, 7,817 m, 8,172 m, 8,076 m, 8,848 m, 8,598 m.
Computation : Median (M) may be calculated in the following steps :
4th item in the arranged series will be the Median.
Arrangement of data in ascending order –
Hence,
Computing Median for Grouped Data
When the scores are grouped, we have to find the value of the point where an individual or observation is centrally located in the group. It can be computed using the following formula :
Where,
M = Median for grouped data
Lower limit of the median class
Interval
Frequency of the median class
Total number of frequencies or number of observations
Cumulative frequency of the pre-median class.
Example 2.4 : Calculate the median for the following distribution :
| class | 50-60 | 60-70 | 70-80 | 80-90 | 90-100 | 100-110 |
| f | 3 | 7 | 11 | 16 | 8 | 5 |
| Class | Frequency (f) | Cumulative Frequency (F) | Calculation of Median Class |
| 50-60 | 3 | 3 | |
| 60-70 | 7 | 10 | |
| 70-80 | 11 | 21c | |
| 80-90(median group) | 16f | 37 | |
| 90-100 | 8 | 45 | |
| 100-110 | 5 | 50 | |
The median is computed in the steps given below :
Mode
The value that occurs most frequently in a distribution is referred to as mode. It is symbolised as Z or . Mode is a measure that is less widely used compared to mean and median. There can be more than one type mode in a given data set.
Computing Mode for Ungrouped Data
While computing mode from the given data sets all measures are first arranged in ascending or descending order. It helps in identifying the most frequently occurring measure easily.
Example 2.5 : Calculate mode for the following test scores in geography for ten students :
Computation : To find the mode the measures are arranged in ascending order as given below:
The measure 61 occurring three times in the series is the mode in the given dataset. As no other number is in the similar way in the dataset, it possesses the property of being unimodal.
Example 2.6 : Calculate the mode using a different sample of ten other students, who scored:
Computation : Arrange the given measures in an ascending order as shown below :
It can easily be observed that measures of 11 and 82 both are occurring three times in the distribution. The dataset, therefore, is bimodal in appearance. If three values have equal and highest frequency, the series is trimodal. Similarly, a recurrence of many measures in a series makes it multimodal. However, when there is no measure being repeated in a series it is designated as without mode.
Comparison of Mean, Median and Mode
The three measures of the central tendency could easily be compared with the help of normal distribution curve. The normal curve refers to a frequency distribution in which the graph of scores often called a bell-shaped curve. Many human traits such as intelligence, personality scores and student achievements have normal distributions. The bell-shaped curve looks the way it does, as it is symmetrical. In other words, most of the observations lie on and around the middle value. As one approaches the extreme values, the number of observations reduces in a symmetrical manner. A normal curve can have high or low data variability. An example of a normal distribution curve is given in Fig. 2.1.
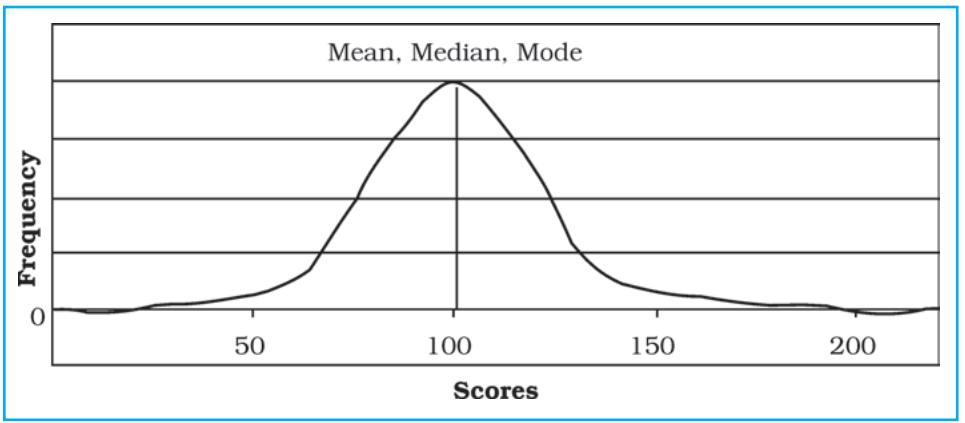
The normal distribution has an important characteristic. The mean, median and mode are the same score (a score of 100 in Fig. 2.1) because a normal distribution is symmetrical. The score with the highest frequency occurs in the middle of the distribution and exactly half of the scores occur above the middle and half of the scores occur below. Most of the scores occur around the middle of the distribution or the mean. Very high and very low scores do not occur frequently and are, therefore, considered rare.
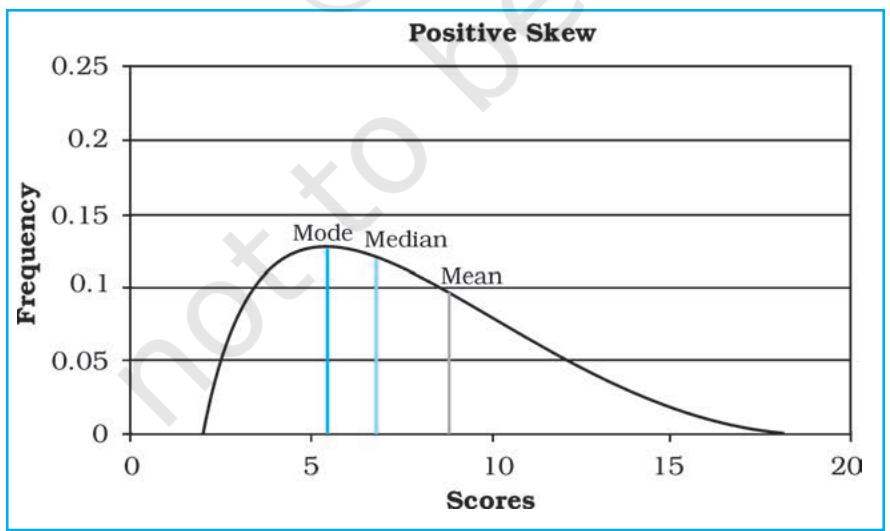
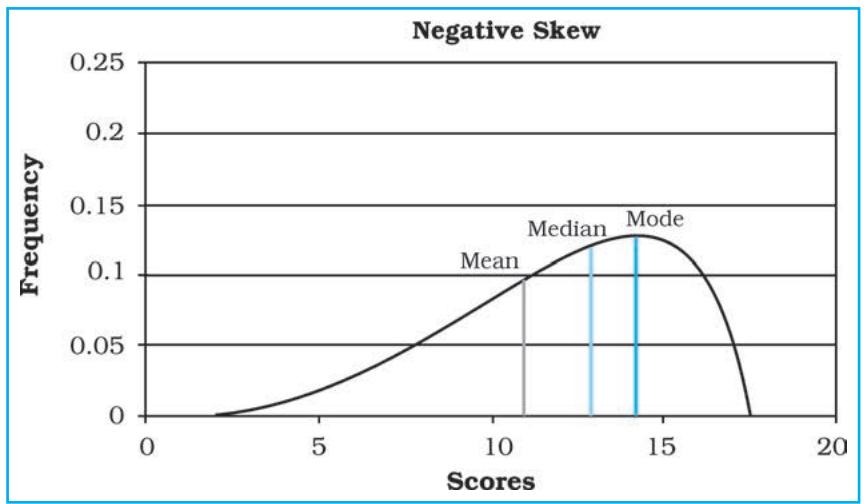
If the data are skewed or distorted in some way, the mean, median and mode will not coincide and the effect of the skewed data needs to be considered (Fig. 2.2 and 2.3).
Exercises
1. Choose the correct answer from the four alternatives given below:
(i) The measure of central tendency that does not get affected by extreme values:
(a) Mean
(b) Mean and Mode
(c) Mode
(d) Median
(ii) The measure of central tendency always coinciding with the hump of any distribution is:
(a) Median
(b) Median and Mode
(c) Mean
(d) Mode
2. Answer the following questions in about 30 words:
3. Answer the following questions in about 125 words:
Activity
1. Take an imaginary example applicable to geographical analysis and explain direct and indirect methods of calculating mean from ungrouped data.