
Unit9
a1
| State/UT Code | India/State/ Union Territory # | Total Population Persons | National Share (%) | Density | Decadal growth rate 2001-11 |
| India | 1210193422 | 100 | 382 | 17.64 | |
| 01 | Jammu & Kashmir | 12,548,926 | 1.04 | 124 | 23.71 |
| 02 | Himachal Pradesh | 6,856,509 | 0.57 | 123 | 12.81 |
| 03 | Punjab | 27,704,236 | 2.29 | 550 | 13.73 |
| 04 | Chandigarh # | 1,054,686 | 0.09 | 9,252 | 17.10 |
| 05 | Uttarakhand | 10,116,752 | 0.84 | 189 | 19.17 |
| 06 | Haryana | 25,353,081 | 2.09 | 573 | 19.90 |
| 07 | NCT of Delhi # | 16,753,235 | 1.38 | 11,297 | 20.96 |
| 08 | Rajasthan | 68,621,012 | 5.67 | 201 | 21.44 |
| 09 | Uttar Pradesh | 199,581,477 | 16.49 | 828 | 20.09 |
| 10 | Bihar | 103,804,637 | 8.58 | 1,102 | 25.07 |
| 11 | Sikkim | 607,688 | 0.05 | 86 | 12.36 |
| 12 | Arunachal Pradesh | 1,382,611 | 0.11 | 17 | 25.92 |
| 13 | Nagaland | 1,980,602 | 0.16 | 119 | -0.47 |
| 14 | Manipur | 2,721,756 | 0.22 | 122 | 18.65 |
| 15 | Mizoram | 1,091,014 | 0.09 | 52 | 22.78 |
| 16 | Tripura | 3,671,032 | 0.30 | 350 | 14.75 |
| 17 | Meghalaya | 2,964,007 | 0.24 | 132 | 27.82 |
| 18 | Assam | 31,169,272 | 2.58 | 397 | 16.93 |
| 19 | West Bengal | 91,347,736 | 7.55 | 1,029 | 13.93 |
| 20 | Jharkhand | 32,966,238 | 2.72 | 414 | 22.34 |
| 21 | Orissa | 41,947,358 | 3.47 | 269 | 13.97 |
| 22 | Chhattisgarh | 25,540,196 | 2.11 | 189 | 22.59 |
| 23 | Madhya Pradesh | 72,597,565 | 6.00 | 236 | 20.30 |
| 24 | Gujarat | 60,383,628 | 4.99 | 308 | 19.17 |
| 25 | Daman & Diu # | 242,911 | 0.02 | 2,169 | 53.54 |
| 26 | Dadra & Nagar Haveli # | 342,853 | 0.03 | 698 | 55.50 |
| 27 | Maharashtra | 112,372,972 | 9.29 | 365 | 15.99 |
| 28 | Andhra Pradesh | 84,665,533 | 7.00 | 308 | 11.10 |
| 29 | Karnataka | 61,130,704 | 5.05 | 319 | 15.67 |
| 30 | Goa | 1,457,723 | 0.12 | 394 | 8.17 |
| 31 | Lakshadweep # | 64,429 | 0.01 | 2,013 | 6.23 |
| 32 | Kerala | 33,387,677 | 2.76 | 859 | 4.86 |
| 33 | Tamil Nadu | 72,138,958 | 5.96 | 555 | 15.60 |
| 34 | Puducherry # | 1,244,464 | 0.10 | 2598 | 27.72 |
| 35 | Andaman & Nicobar Islands # | 379,944 | 0.03 | 46 | 6.68 |
Appendix (ii)
| Decades | Crude Birth Rate Per 1000 | Crude Death Rate Per 1000 | Rate of Natural Increase (Per 1000) |
| 1901 - 1911 | 49.2 | 42.6 | 6.6 |
| 1911 - 1921 | 48.1 | 47.2 | 0.9 |
| 1921 - 1931 | 46.4 | 36.2 | 10.2 |
| 1931 - 1941 | 45.9 | 37.2 | 8.7 |
| 1941 - 1951 | 39.9 | 27.4 | 12.5 |
| 1951 - 1961 | 41.7 | 22.8 | 18.9 |
| 1961 - 1971 | 41.1 | 19.0 | 22.1 |
| 1971 - 1981 | 37.2 | 15 | 22.2 |
| 1981 - 1991 | 29.5 | 9.8 | 19.7 |
| 1991 - 2001 | 25.4 | 8.4 | 17.0 |
| 2001 - 2011 | 21.8 | 7.1 | 14.7 |
| State/UT Code | India/State/Union Territory | Population | Percentage of Urban Population | |
| Rural | Urban | |||
| India | 833087662 | 377,105,760 | 31.16 | |
| 01 | Jammu & Kashmir | 9,134,820 | 3,414,106 | 27.21 |
| 02 | Himachal Pradesh | 6,167,805 | 688,704 | 10.04 |
| 03 | Punjab | 17,316,800 | 10,387,436 | 37.49 |
| 04 | Chandigarh | 29,004 | 1,025,682 | 97.25 |
| 05 | Uttarakhand | 7,025,583 | 3,091,169 | 30.55 |
| 06 | Haryana | 16,531,493 | 8,821,588 | 34.79 |
| 07 | NCT of Delhi | 419,319 | 16,333,916 | 97.50 |
| 08 | Rajasthan | 51,540,236 | 17,080,776 | 24.89 |
| 09 | Uttar Pradesh | 155,111,022 | 44,470,455 | 22.28 |
| 10 | Bihar | 92,075,028 | 11,729,609 | 11.30 |
| 11 | Sikkim | 455,962 | 151,726 | 24.97 |
| 12 | Arunachal Pradesh | 1,069,165 | 313,446 | 22.67 |
| 13 | Nagaland | 1,406,861 | 573,741 | 28.97 |
| 14 | Manipur | 1,899,624 | 822,132 | 30.21 |
| 15 | Mizoram | 529,037 | 561,977 | 51.51 |
| 16 | Tripura | 2,710,051 | 960,981 | 26.18 |
| 17 | Meghalaya | 2,368,971 | 595,036 | 20.08 |
| 18 | Assam | 26,780,516 | 4,388,756 | 14.08 |
| 19 | West Bengal | 62,213,676 | 29,134,060 | 31.89 |
| 20 | Jharkhand | 25,036,946 | 7,929,292 | 24.05 |
| 21 | Orissa | 34,951,234 | 6,996,124 | 16.68 |
| 22 | Chhattisgarh | 19,603,658 | 5,936,538 | 23.24 |
| 23 | Madhya Pradesh | 52,537,899 | 20,059,666 | 27.63 |
| 24 | Gujarat | 34,670,817 | 25,712,811 | 42.58 |
| 25 | Daman & Diu | 60,331 | 182,580 | 75.16 |
| 26 | Dadra & Nagar Haveli | 183,024 | 159,829 | 46.62 |
| 27 | Maharashtra | 61,545,441 | 50,827,531 | 45.23 |
| 28 | Andhra Pradesh | 56,311,788 | 28,353,745 | 33.49 |
| 29 | Karnataka | 37,552,529 | 23,578,175 | 38.57 |
| 30 | Goa | 551,414 | 906,309 | 62.17 |
| 31 | Lakshadweep | 14,121 | 50,308 | 78.08 |
| 32 | Kerala | 17,455,506 | 15,932,171 | 47.72 |
| 33 | Tamil Nadu | 37,189,229 | 34,949,729 | 48.45 |
| 34 | Puducherry | 394,341 | 850,123 | 68.31 |
| 35 | Andaman & Nicobar Islands | 244,411 | 135,533 | 35.67 |
| States/Union Territories | Hindus | Muslims | Christians | Sikhs | Buddhists | Jains | Other Religions | Religions not stated |
| Jammu & Kashmir | 28.44 | 68.31 | 0.28 | 1.87 | 0.90 | 0.02 | 0.01 | 0.16 |
| Himachal Pradesh | 95.17 | 2.18 | 0.18 | 1.16 | 1.15 | 0.03 | 0.01 | 0.12 |
| Punjab | 38.49 | 1.93 | 1.26 | 57.69 | 0.12 | 1.16 | 0.04 | 0.32 |
| Chandigarh | 80.78 | 4.87 | 0.83 | 13.11 | 0.11 | 0.19 | 0.02 | 0.10 |
| Uttarakhand | 82.97 | 13.95 | 0.37 | 2.34 | 0.15 | 0.09 | 0.01 | 0.12 |
| Haryana | 87.46 | 7.03 | 0.20 | 4.91 | 0.03 | 0.21 | 0.01 | 0.17 |
| Delhi | 81.68 | 12.86 | 0.87 | 3.40 | 0.11 | 0.99 | 0.01 | 0.08 |
| Rajasthan | 88.49 | 9.07 | 0.14 | 1.27 | 0.02 | 0.91 | 0.01 | 0.10 |
| Uttar Pradesh | 79.73 | 19.26 | 0.18 | 0.32 | 0.10 | 0.11 | 0.01 | 0.29 |
| Bihar | 82.69 | 16.87 | 0.12 | 0.02 | 0.02 | 0.02 | 0.01 | 0.24 |
| Sikkim | 57.76 | 1.62 | 9.91 | 0.31 | 27.39 | 0.05 | 2.67 | 0.30 |
| Arunachal Pradesh | 29.04 | 1.95 | 30.26 | 0.24 | 11.77 | 0.06 | 26.20 | 0.48 |
| Nagaland | 8.75 | 2.47 | 87.93 | 0.10 | 0.34 | 0.13 | 0.16 | 0.12 |
| Manipur | 41.39 | 8.40 | 41.29 | 0.05 | 0.25 | 0.06 | 8.19 | 0.38 |
| Mizoram | 2.75 | 1.35 | 87.16 | 0.03 | 8.51 | 0.03 | 0.07 | 0.09 |
| Tripura | 83.40 | 8.60 | 4.32 | 0.03 | 3.41 | 0.02 | 0.04 | 0.14 |
| Meghalaya | 11.53 | 4.40 | 74.59 | 0.10 | 0.33 | 0.02 | 8.71 | 0.32 |
| Assam | 61.47 | 34.22 | 3.74 | 0.07 | 0.18 | 0.08 | 0.09 | 0.16 |
| West Bengal | 70.54 | 27.01 | 0.72 | 0.07 | 0.31 | 0.07 | 1.03 | 0.25 |
| Jharkhand | 67.83 | 14.53 | 4.30 | 0.22 | 0.03 | 0.05 | 12.84 | 0.21 |
| Orissa | 93.63 | 2.17 | 2.77 | 0.05 | 0.03 | 0.02 | 1.14 | 0.18 |
| Chhattisgarh | 93.25 | 2.02 | 1.92 | 0.27 | 0.28 | 0.24 | 1.94 | 0.09 |
| Madhya Pradesh | 90.89 | 6.57 | 0.29 | 0.21 | 0.30 | 0.78 | 0.83 | 0.13 |
| Gujarat | 88.57 | 9.67 | 0.52 | 0.10 | 0.05 | 0.96 | 0.03 | 0.10 |
| Daman & Diu | 90.50 | 7.92 | 1.16 | 0.07 | 0.09 | 0.21 | 0.03 | 0.10 |
| Dadra & Nagar | ||||||||
| Haveli | 93.93 | 3.76 | 1.49 | 0.06 | 0.18 | 0.35 | 0.09 | 0.14 |
| Maharashtra | 79.83 | 11.54 | 0.96 | 0.20 | 5.81 | 1.25 | 0.16 | 0.25 |
| Andhra Pradesh | 88.46 | 9.56 | 1.34 | 0.05 | 0.04 | 0.06 | 0.01 | 0.48 |
| Karnataka | 84.00 | 12.92 | 1.87 | 0.05 | 0.16 | 0.72 | 0.2 | 0.27 |
| Goa | 66.08 | 8.33 | 25.10 | 0.10 | 0.08 | 0.08 | 0.02 | 0.21 |
| Lakshadweep | 2.77 | 96.58 | 0.49 | 0.01 | 0.02 | 0.02 | 0.01 | 0.10 |
| Kerala | 54.73 | 26.56 | 18.38 | 0.01 | 0.01 | 0.01 | 0.02 | 0.26 |
| Tamil Nadu | 87.58 | 5.86 | 6.12 | 0.02 | 0.02 | 0.12 | 0.01 | 0.26 |
| Puducherry | 87.30 | 6.05 | 6.29 | 0.02 | 0.04 | 0.11 | 0.01 | 0.17 |
| Andaman & Nicobar Islands | 69.45 | 8.52 | 21.28 | 0.34 | 0.09 | 0.01 | 0.15 | 0.18 |
Appendix (v)
India: Work Participation Rate and Occupation Structure, 2011
| States/UTs | Work Participation Rate (%) | Cultivators | % to Total Workers | Agricultural Labourers | % to Total Workers | Household Industries | % to Total Workers | Other Workers | % to Total Workers |
| INDIA | 39.8 | 11,86,92,640 | 24.6 | 14,43,29,833 | 30 | 1,83,36,307 | 3.8 | 20,03,84,531 | 41.6 |
| Jammu & Kashmir | 34.5 | 12,45,316 | 28.8 | 5,47,705 | 12.7 | 1,72,586 | 4 | 23,57,106 | 54.5 |
| Himachal Pradesh | 51.9 | 20,62,062 | 57.9 | 1,75,038 | 4.9 | 58,719 | 1.6 | 12,63,603 | 35.5 |
| Punjab | 35.7 | 19,34,511 | 19.5 | 15,88,455 | 16 | 3,85,960 | 3.9 | 59,88,436 | 60.5 |
| Chandigarh | 38.3 | 2,578 | 0.6 | 1,687 | 0.4 | 4,799 | 1.2 | 3,95,072 | 97.8 |
| Uttarakhand | 38.4 | 15,80,423 | 40.8 | 4,03,301 | 10.4 | 1,14,312 | 3 | 17,74,239 | 45.8 |
| Haryana | 35.2 | 24,80,801 | 27.8 | 15,28,133 | 17.1 | 2,62,280 | 2.9 | 46,45,294 | 52.1 |
| NCT of Delhi | 33.3 | 33,398 | 0.6 | 39,475 | 0.7 | 1,81,852 | 3.3 | 53,32,324 | 95.4 |
| Rajasthan | 43.6 | 1,36,18,870 | 45.6 | 49,39,664 | 16.5 | 7,20,573 | 2.4 | 1,06,07,148 | 35.5 |
| Uttar Pradesh | 32.9 | 1,90,57,888 | 29 | 1,99,39,223 | 30.3 | 38,98,590 | 5.9 | 2,29,19,014 | 34.8 |
| Bihar | 33.4 | 71,96,226 | 20.7 | 1,83,45,649 | 52.8 | 14,11,208 | 4.1 | 77,71,904 | 22.4 |
| Sikkim | 50.5 | 1,17,401 | 38.1 | 25,986 | 8.4 | 5,143 | 1.7 | 1,59,608 | 51.8 |
| Arunachal Pradesh | 42.5 | 3,02,723 | 51.5 | 36,171 | 6.2 | 8,365 | 1.4 | 2,40,398 | 40.9 |
| Nagaland | 49.2 | 5,37,702 | 55.2 | 62,962 | 6.5 | 22,838 | 2.3 | 3,50,620 | 36 |
| Manipur | 45.1 | 4,57,891 | 39.5 | 1,11,061 | 9.6 | 89,495 | 7.7 | 5,00,606 | 43.2 |
| Mizoram | 44.4 | 2,29,603 | 47.2 | 41,787 | 8.6 | 7,852 | 1.6 | 2,07,463 | 42.6 |
| Tripura | 40 | 2,95,947 | 20.1 | 3,53,618 | 24.1 | 41,496 | 2.8 | 7,78,460 | 53 |
| Meghalaya | 40 | 4,94,675 | 41.7 | 1,98,364 | 16.7 | 20,488 | 1.7 | 4,72,092 | 39.8 |
| Assam | 38.4 | 40,61,627 | 33.9 | 18,45,346 | 15.4 | 4,91,321 | 4.1 | 55,71,396 | 46.5 |
| West Bengal | 38.1 | 51,16,668 | 14.7 | 1,01,88,842 | 29.3 | 24,64,124 | 7.1 | 1,69,86,701 | 48.9 |
| Jharkhand | 39.7 | 38,14,832 | 29.1 | 44,36,052 | 33.9 | 4,55,162 | 3.5 | 43,92,228 | 33.5 |
| Orissa | 41.8 | 41,03,989 | 23.4 | 67,39,993 | 38.4 | 7,83,080 | 4.5 | 59,14,527 | 33.7 |
| Chhattisgarh | 47.7 | 40,04,796 | 32.9 | 50,91,882 | 41.8 | 1,87,631 | 1.5 | 28,95,916 | 23.8 |
| Madhya Pradesh | 43.5 | 89,44,439 | 31.2 | 1,21,92,267 | 38.6 | 9,59,259 | 3 | 85,78,168 | 27.2 |
| Gujarat | 41 | 54,47,500 | 22 | 68,39,415 | 27.6 | 3,43,999 | 1.4 | 1,21,36,833 | 49 |
| Daman & Diu | 49.9 | 2,316 | 1.9 | 772 | 0.6 | 684 | 0.6 | 1,17,499 | 96.9 |
| D & N Haveli | 45.7 | 28,164 | 17.9 | 17,799 | 11.3 | 2,195 | 1.4 | 1,09,003 | 69.4 |
| Maharashtra | 44 | 1,25,69,373 | 25.4 | 1,34,86,140 | 27.3 | 12,25,426 | 2.5 | 2,21,46,939 | 44.8 |
| Andhra Pradesh | 46.6 | 64,91,522 | 16.5 | 1,69,67,754 | 43 | 14,39,137 | 3.7 | 1,45,24,493 | 36.8 |
| Karnataka | 45.6 | 65,80,649 | 23.6 | 71,55,963 | 25.7 | 9,13,227 | 3.3 | 1,32,22,758 | 47.4 |
| Goa | 39.6 | 31,354 | 5.4 | 26,760 | 4.6 | 14,708 | 2.5 | 5,04,426 | 87.4 |
| Lakshadweep | 29.1 | 0 | 0 | 0 | 0 | 264 | 1.4 | 18,489 | 98.6 |
| Kerala | 34.8 | 6,70,253 | 5.8 | 13,22,850 | 11.4 | 2,73,022 | 2.3 | 93,52,938 | 80.5 |
| Tamil Nadu | 45.6 | 42,48,457 | 12.9 | 96,06,547 | 29.2 | 13,64,893 | 4.2 | 1,76,64,784 | 53.7 |
| Puducherry | 35.7 | 12,099 | 2.7 | 68,391 | 15.4 | 7,892 | 1.8 | 3,56,586 | 80.1 |
| A & N Islands | 40.1 | 16,567 | 10.9 | 4,781 | 3.1 | 3,727 | 2.4 | 1,27,460 | 83.6 |
Appendix (vi)
| Land Use Classes | 1950–51(Million Hectare) | Per cent | 2019–20(Million Hectare) | Per cent |
| Reporting Area | 284.32 | 100 | 306.5 | 100 |
| Forests | 40.48 | 17.0 | 71.75 | 23.4 |
| Area under non-agricultural use | 9.36 | 3.2 | 27.77 | 9.0 |
| Barren and unculturable waste Land | 38.16 | 13.4 | 16.54 | 5.4 |
| Permanent Pasturer and Grazing Land | 6.68 | 2.3 | 10.48 | 3.4 |
| Area under Misc. Tree crops and Groves | 19.83 | 6.9 | 3.13 | 1.0 |
| Culturable Waste Land | 22.94 | 8.0 | 11.95 | 3.9 |
| Fallow other than Current Fallow | 17.45 | 6.1 | 11.24 | 3.7 |
| Current Fallow | 10.68 | 3.7 | 13.77 | 4.5 |
| Net Area Sown | 118.75 | 41.7 | 139.90 | 45.6 |
| S. No. | Crop | % Share in World Production and rank (2018) |
| 1 | Rice | 22.07 (Second) |
| 2 | Wheat | 13.58 (Second) |
| I | Total Cereals | 10.74 (Third) |
| II | All Pulses | 27.63 (First) |
| 8 | Groundnut | 18.18 (Second) |
| 9 | Rape seed | 11.24 (Third) |
| 10 | Jute | 53.72 (First) |
| 11 | Sugarcane | 19.76 (Second) |
| 12 | Tea | 21.22 (Second) |
| 13 | Coffee | 3.17 (Eight) |
| Group of Crops | Crops | States | Production* |
| (1) | (2) | (3) | (4) |
| 1. Foodgrains | |||
| Rice | West Bengal | 15.57 | |
| Uttar Pradesh | 15.52 | ||
| Punjab | 11.78 | ||
| All India | 118.43 | ||
| Wheat | Uttar Pradesh | 32.59 | |
| Madhya Pradesh | 19.61 | ||
| Punjab | 17.57 | ||
| All India | 107.59 | ||
| Maize | Karnataka | 3.96 | |
| Madhya Pradesh | 3.91 | ||
| Telangana | 3.00 | ||
| All India | 28.64 | ||
| Total Nutri/Coarse Cereals | Rajasthan | 7.29 | |
| Karnataka | 6.45 | ||
| Madhya Pradesh | 4.82 | ||
| All India | 47.48 | ||
| Total Pulses | Rajasthan | 4.49 | |
| Maharashtra | 4.03 | ||
| Madhya Pradesh | 3.80 | ||
| All India | 23.15 | ||
| Total Foodgrains | Uttar Pradesh | 55.03 | |
| Madhya Pradesh | 33.03 | ||
| Punjab | 30.02 | ||
| All India | 296.65 | ||
| II. Oilseeds | |||
| Groundnut | Gujarat | 4.64 | |
| Rajasthan | 1.62 | ||
| Tamilnadu | 0.98 | ||
| All India | 10.10 | ||
| Rapesseed & Mustard | Rajasthan | 4.22 | |
| Haryana | 1.15 | ||
| Uttar Pradesh | 0.96 | ||
| All India | 9.12 | ||
| Soyabean | Madhya Pradesh | 5.15 | |
| Maharashtra | 4.60 | ||
| Rajasthan | 0.52 | ||
| All India | 11.22 | ||
| Sunflower | Karnataka | 0.12 | |
| Odisha | 0.03 | ||
| Bihar | 0.01 | ||
| All India | 0.22 | ||
| Group of Crops | Crops | States | Production |
| (1) | (2) | (3) | (4) |
| III. Other Cash Crops | Total Oilseeds | Rajasthan | 6.79 |
| Gujarat | 6.66 | ||
| Madhya Pradesh | 6.57 | ||
| All India | 33.42 | ||
| Sugarcane | Uttar Pradesh | 178.42 | |
| Maharashtra | 64.67 | ||
| Karnataka | 31.60 | ||
| All India | 355.70 | ||
| Cotton@ | Gujarat | 8.28 | |
| Telangana | 6.83 | ||
| Maharashtra | 6.782 | ||
| All India | 35.491 | ||
| Jute & Mesta$ | West Bengal | 8.0572 | |
| Bihar | 0.86 | ||
| Assam | 0.77 | ||
| All India | 9.91 |
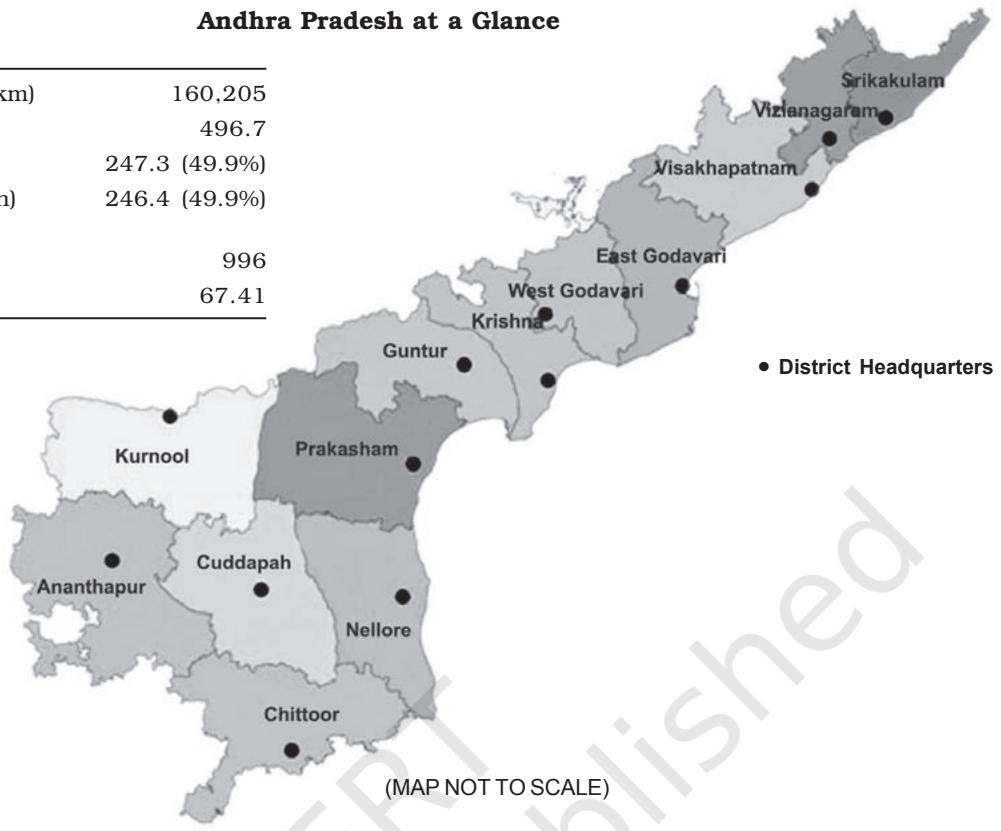
| Geographical Area (Sq. km) | 160,205 |
| Total Population (Lakh) | 496.7 |
| Male Population (Lakh) | 247.3 (49.9%) |
| Female Population (Lakh) | 246.4 (49.9%) |
| Sex Ratio (Females per 1000 males) | 996 |
| Literacy Rate (%) | 67.41 |
•
Alagh, Y. K. 1990. Agro-Climatic Planning and Regional Development, Indian Journal of Agricultural Economics, 45(3): 244-268.
•
Ashis Nandi (1998): Science, Hegemony and Violence: A Requiem for Modernity, Oxford University Press, Oxford.
•
Baker, Susan 2006. Sustainable Development, Routledge, London.
•
Bhalla, G. S. (ed.) 1994. Economic Liberalization and Indian Agriculture, Institute for Studies in Industrial Development, New Delhi
•
Chand, Mahesh and V. K. Puri, 1983. Regional Planning in India, Allied Publishers Limited, New Delhi.
•
Dantwala, M. L. and others 1986. Indian Agricultural Development Since Independence, Indian Society of Agricultural Development, New Delhi.
•
Elliot, Jennifer A 1994. An Introduction to Sustainable Development, Routledge, London.
•
Government of India. 1998. 'Water Statistics of India'. Central Water Commission, New Delhi.
•
Government of India. 1999. 'Integrated Water Resources Development – A Plan for Action'. National Commission for Integrated Water Resources Development, Ministry of Water Resources, New Delhi.
•
Government of India. 2002. ‘National Water Policy 2002’. Ministry of Water Resources, New Delhi.
•
Government of India. 2002. Water Supply and Sanitation: A WHO – UNICEF Sponsored Study'. Planning Commission, New Delhi.
•
Ivan Illich (1981): The De-linking of Peace and Development, Gandhi Marg, pp.257-65.
•
Jaglan, M. S. 1990. Impact of Irrigation on Environmental and Socio-economic Conditions: A Case Study of Indira Gandhi Canal Command Area, unpublished thesis, CSRD, SSS, Jawaharlal Nehru University, New Delhi.
•
Jaglan, M. S. and M. H. Qureshi, 1996. Irrigation Development and Its Environmental Consequences in Arid Areas of India, Environmental Management, 20(3): 323-336.
•
Kumar, R, R. D. Singh and K. D. Sharma 2005. 'Water Resources of India', Current Science, 89(5), pp.794-811.
•
Kuper, A. and Jessica Kuper, 1989. The Social Science Encyclopedia, Routledge Publishers, New York.
•
Kurup, Raghava C. G. (ed.) 1966, Handbook of Agriculture, Indian Council of Agricultural Research, New Delhi.
•
Mahbub-ul-Haq (1993): Human Development in a Changing World, United Nations Development Programme (UNDP) Occasional Paper-4.
•
Mishra, R. P. 1988. On the Concept of Region and Regional Planning, in Moonis Raza (ed.) Contribution to Indian Geography: Regional Development, Heritage Publishers, New Delhi.
•
Paul, Streeten (1984); Basic Needs: Some Unsettled Questions, World Development, Vol.12, No. 9, pp. 973-78.
•
Paul, Streeten (1995): Human Development: The Debate about the Index, International Social Science Journal No. 143, pp-25-37.
•
Planning Commission of India, Eighth Five Year Plan (1992-97), Vol. I, Government of India, New Delhi.
•
Soni, V. 2003. 'Water Carrying Capacity of a City: Delhi'. Economic and Political Weekly, November, 8, pp.4745-4749.
•
Sudhir Anand and Amartya K.Sen. 1994. Human Development Index: Methodology and Measurement, Human Development Report Office, Occasional Papers, pp.1-19.
•
Sudhir Anand and Martin Ravallion. 1993. Human Development in Poor Countries: On the Role of Private Incomes and Public Services, Journal of Economic Perspectives, Vol. 7, No. 1, pp.133-150.
•
Sundaram, K.V. 1986. Urban and Regional Planning in India, Vikas Publishing House, New Delhi.
•
Thakur, B. R. 2005. Socio-economic Transformation in Bharmaur Tribal Area of Himachal Pradesh since Inception of ITDP, unpublished PhD thesis, Department of Geography, Kurukshetra University, Kurukshetra
•
Tisdell, Clement A. 1990. Natural Resources, Growth and Development, Prager Publishers, New York.
•
UNDP. 1990-2003. Human Development Reports, Oxford University Press, Oxford.
•
Wilbanks, Thomas J. 1994. Sustainable Development in Geographic Perspective, AAG, 84(4): 541-556.
•
World Commission on Environment and Development (WECD). 1987. Our Common Future, Oxford University Press, Oxford.
•
World Development Report. 1992. Development and Environment, Oxford University Press. Oxford.